![]() Pacific Coast School 2024
Pacific Coast School 2024
What are the unique, positive characteristics of our school?
What are the important demographics of our school and community?
The demographics for PCS's 2021/22 school year our school had the following demographics:
- 98.2% Indigenous Population
- 31.0% actively designated students
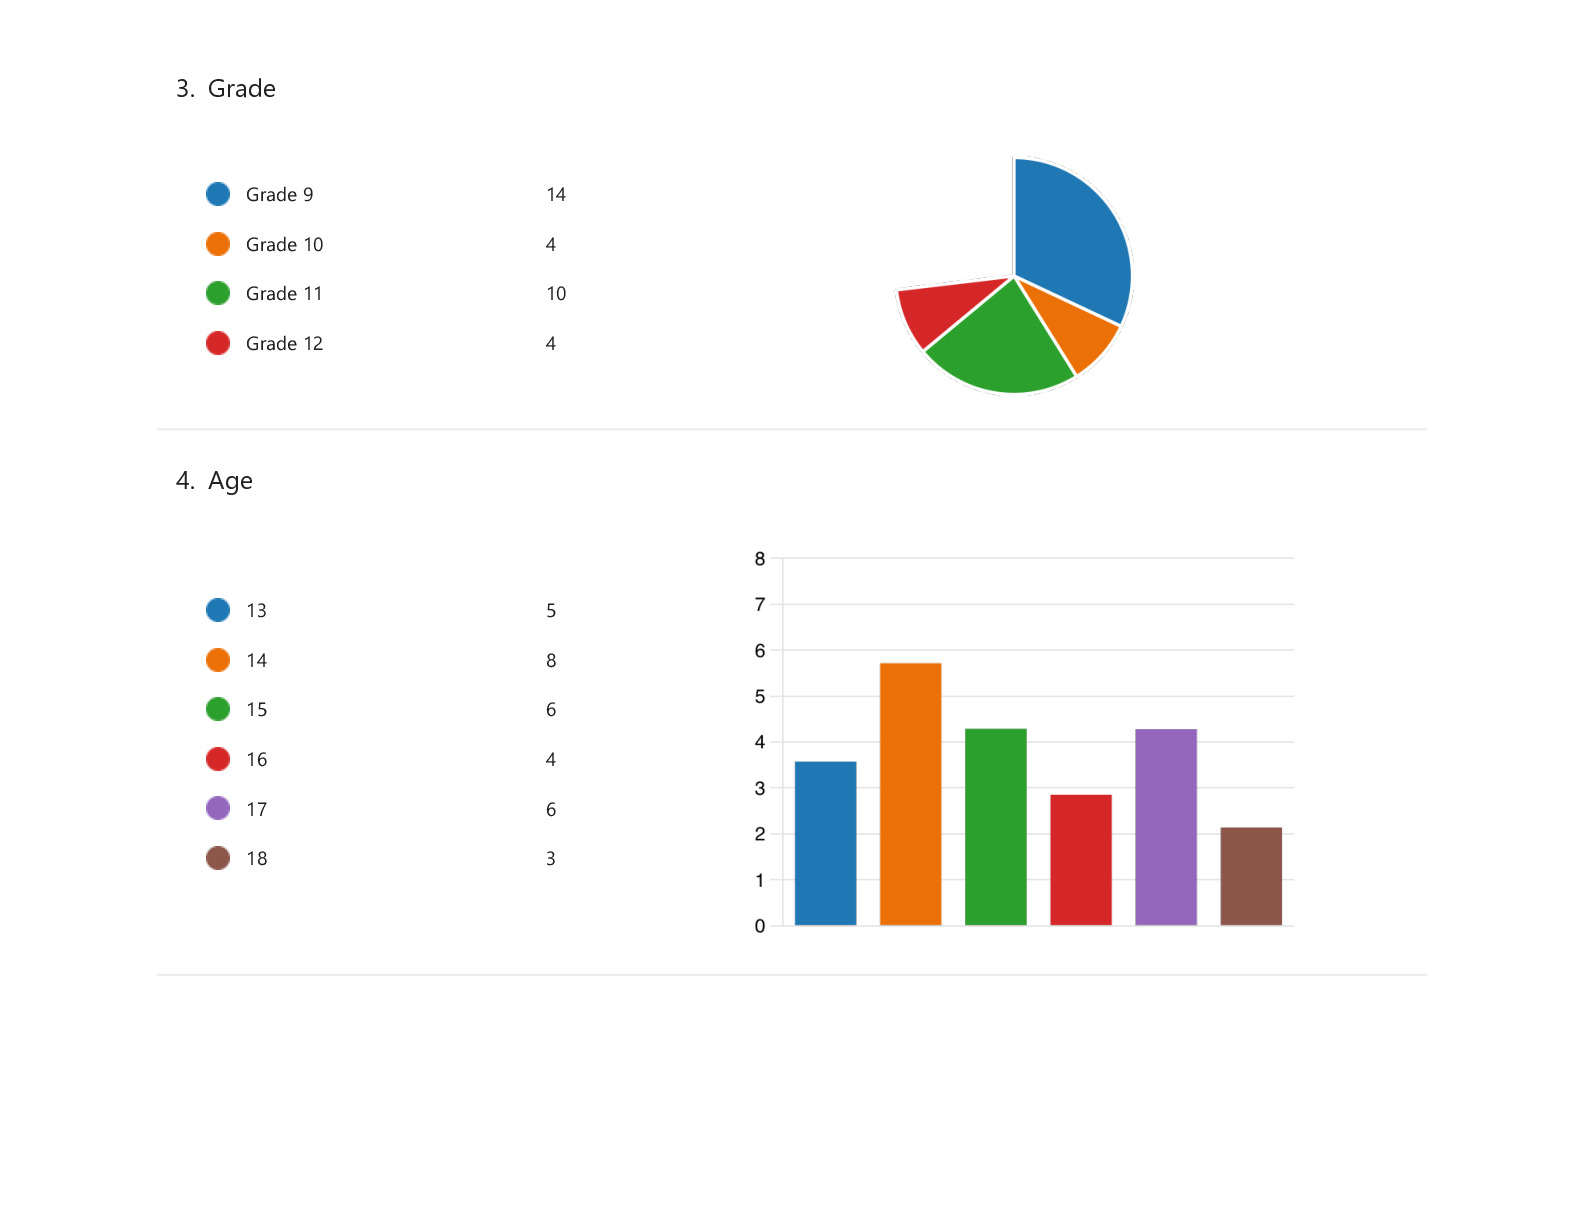
- 18.9% Grade 9
- 15.5% Grade 10
- 41.4% Grade 11
- 24.1% Grade 12
This year we have 32 students interview for enrolment at PCS. Demographics of new students are attached as a support file.
PCS Intake Interview Data
What do we celebrate?
PCS celebrates the tenacity and dedication of our students to attend and progress despite all odds. While we did not get all our grads to the point of graduation, we did get most of our grads to progress and develop as persons and community members. This includes supporting employment, developing healthy habits, supporting students with social services and child rearing. PCS celebrates all our student's success including the 6 students who walked up this year at the Lester Centre.
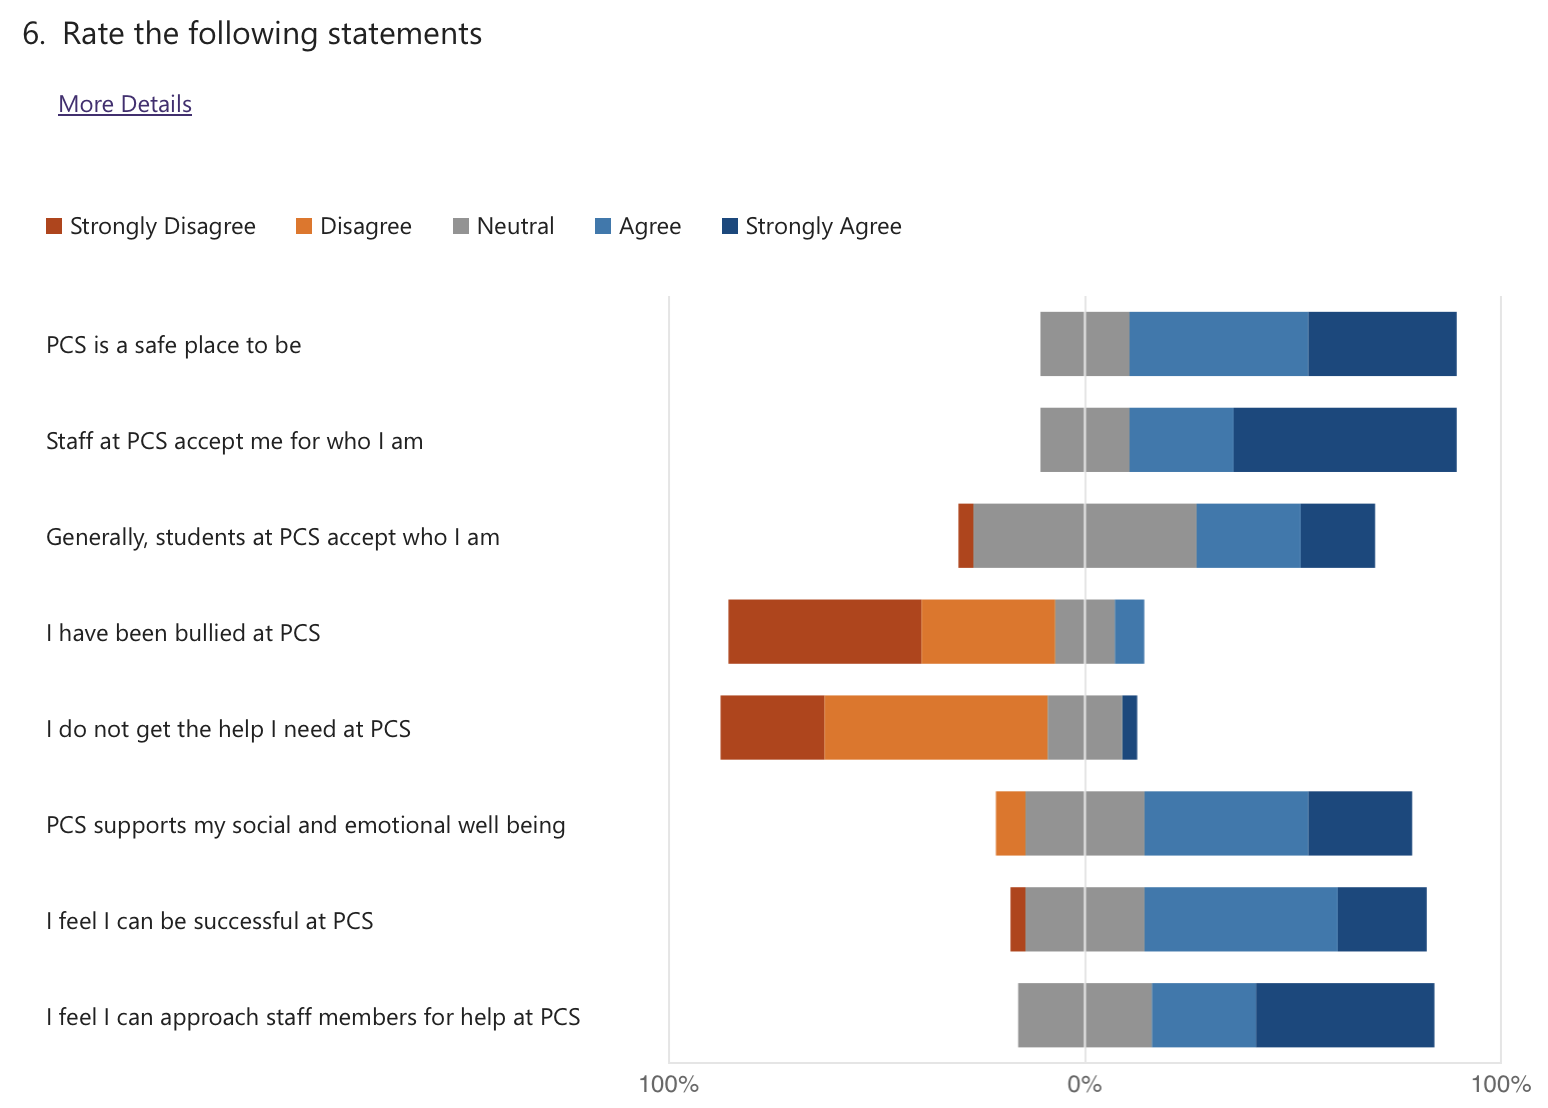
We also celebrate our school teams ability to create a welcoming and engaging space for students. In the FESL survey our students communicated that this is a place they come to engage with a health social environment and healthy adults.
- 82% of students responded positively to the statement "I feel comfortable in my school"
- 85% of students responded positively to the statement "I belong in my school"
- 97% of students responded positively to the statement "There are adults at the school that care about me"
- 92% of students responded positively to the statement "When I have a problem, there are people at school to help me"
- 97% of students responded positively to the statement "I know the expectations for behaviour at my school"
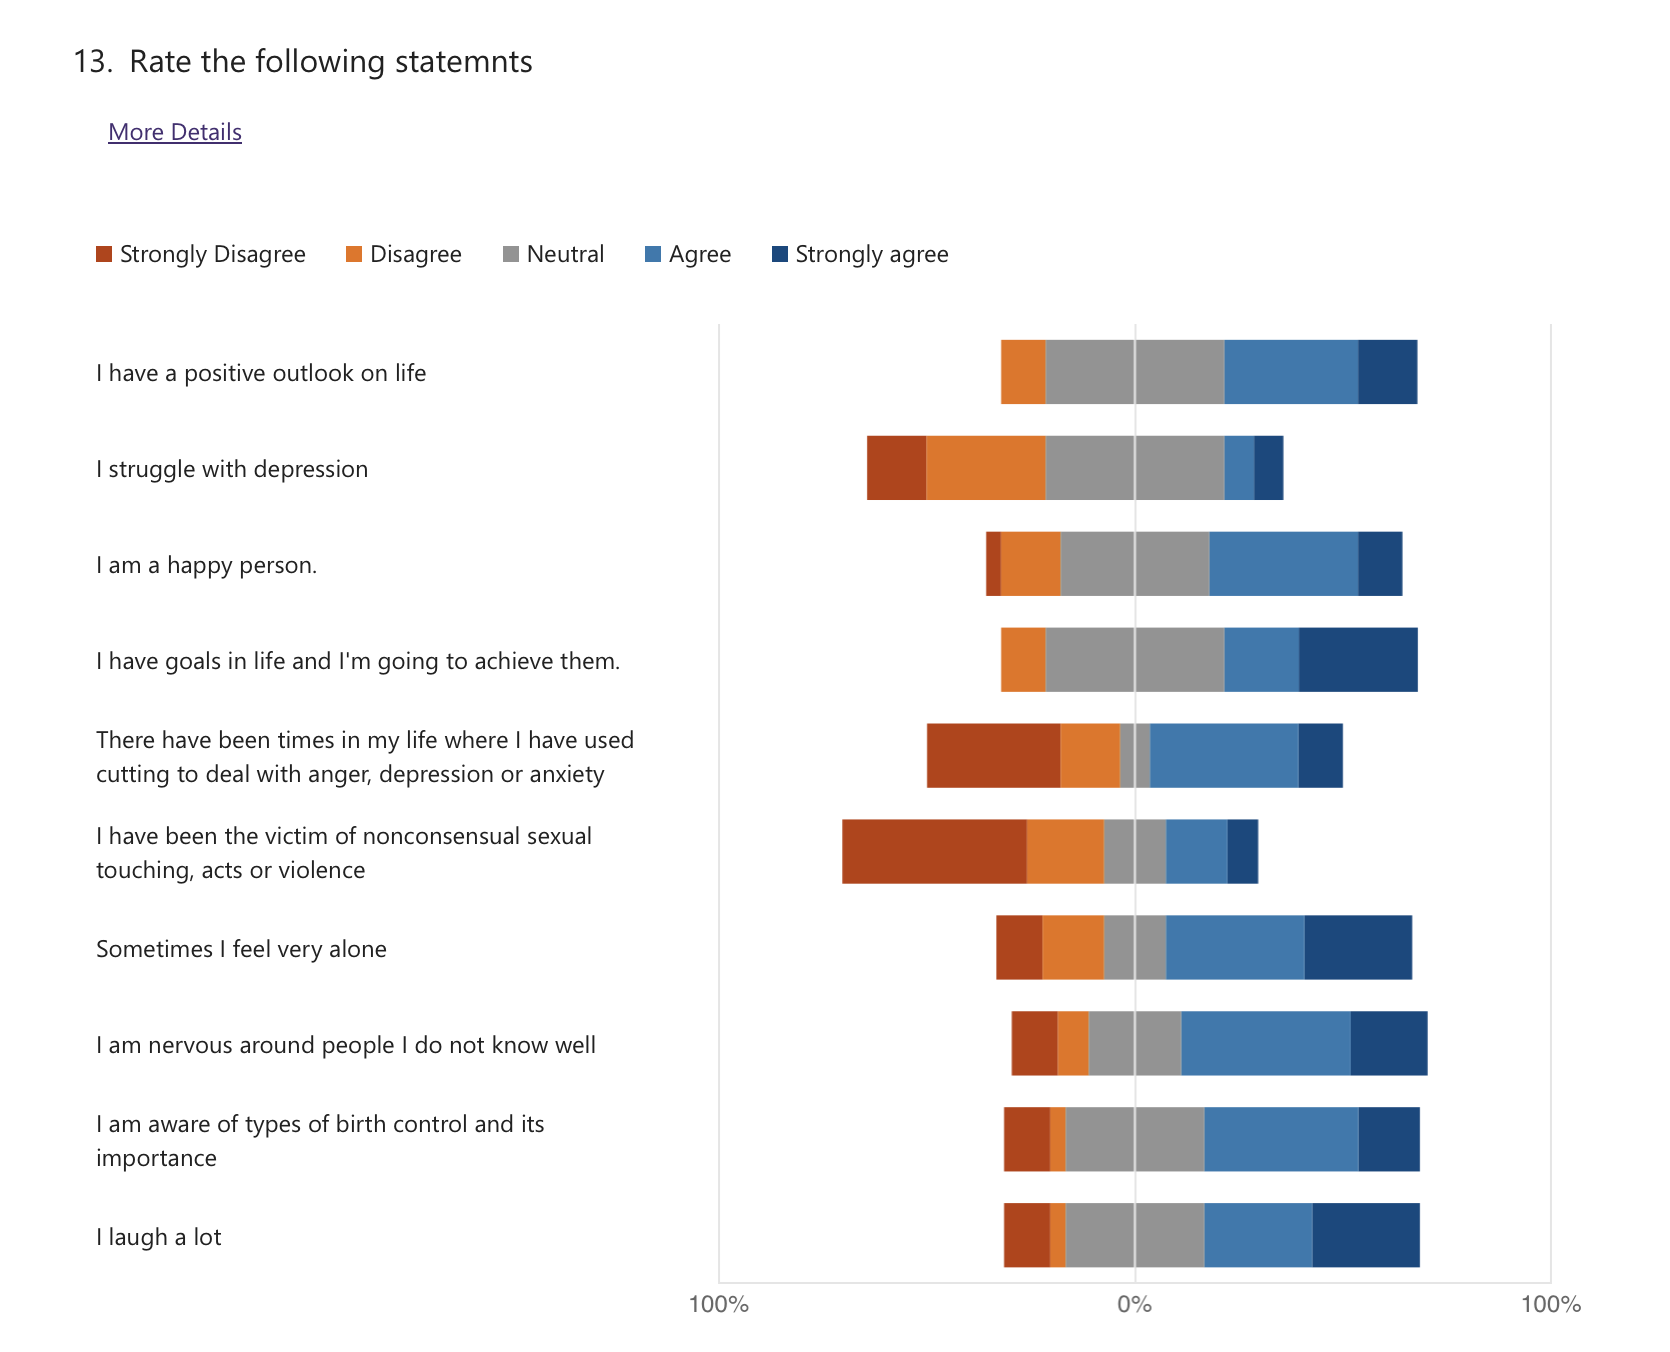
While we would like to see 100% in every singly one of those categories, we are proud that our staff is providing a space in which students feel safe and students can grow in a healthy and engaging environment. PCS is celebrates that students here know how to set goals for themselves and feel hopeful for the future.
- 80% of students responded positively to the statement "I set goals for myself"
- 61% of students responded positively to the statement "I feel hopeful about the future"
PCS also celebrates the healthy activities we did as a school such as kayaking, hiking, skiing and the successful Family Day at Diana Lake.
What are the strengths and stretches we see in our learners?
Strengths: Our students create an inclusive environment and a respectful school. PCS students in general care about PCS, the staff and their fellow students. All our students overcome some types of barrier to get to school. Whether that is Anxiety, Depression, Trauma, Addiction, Food and Housing Security or something else, the fact that they are at our school means they struggle with barriers to their education and engagement. As such, PCS staff celebrates our student's strength of will and desire to engage in learning and bettering themselves.
Another significant strength is our student's acceptance of all students and inclusive environment. Our students are surprisingly accepting of all students who come through our doors. This melody, which starts with our staff, has been taken on by our students and has, on the whole, created a resonant harmony within our school.
This year was one we can classify as a more normal post-COVID year. There were a number of students whose families choose to not attend due to COVID who shifted gears this year and made sure their students engaged this year.
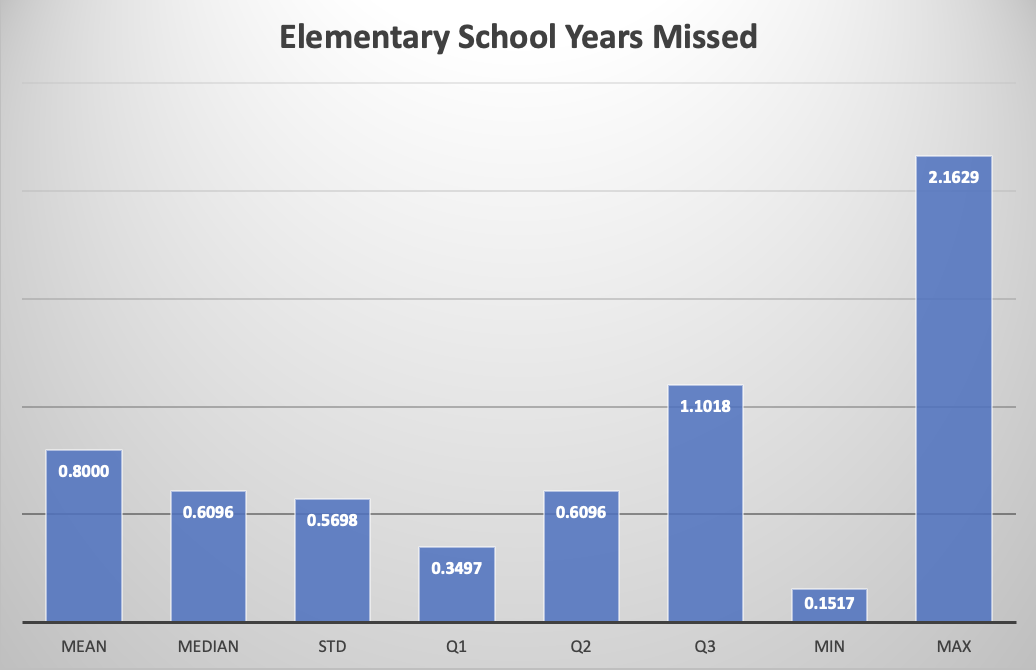
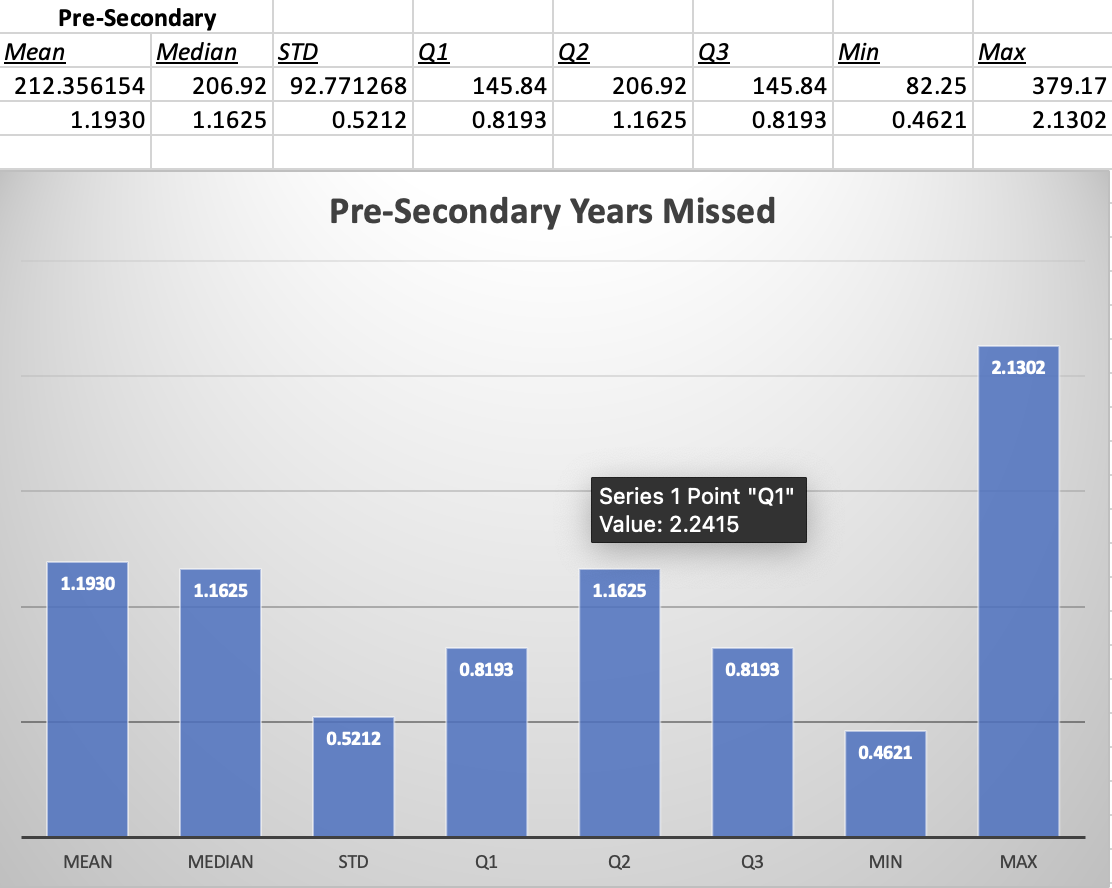
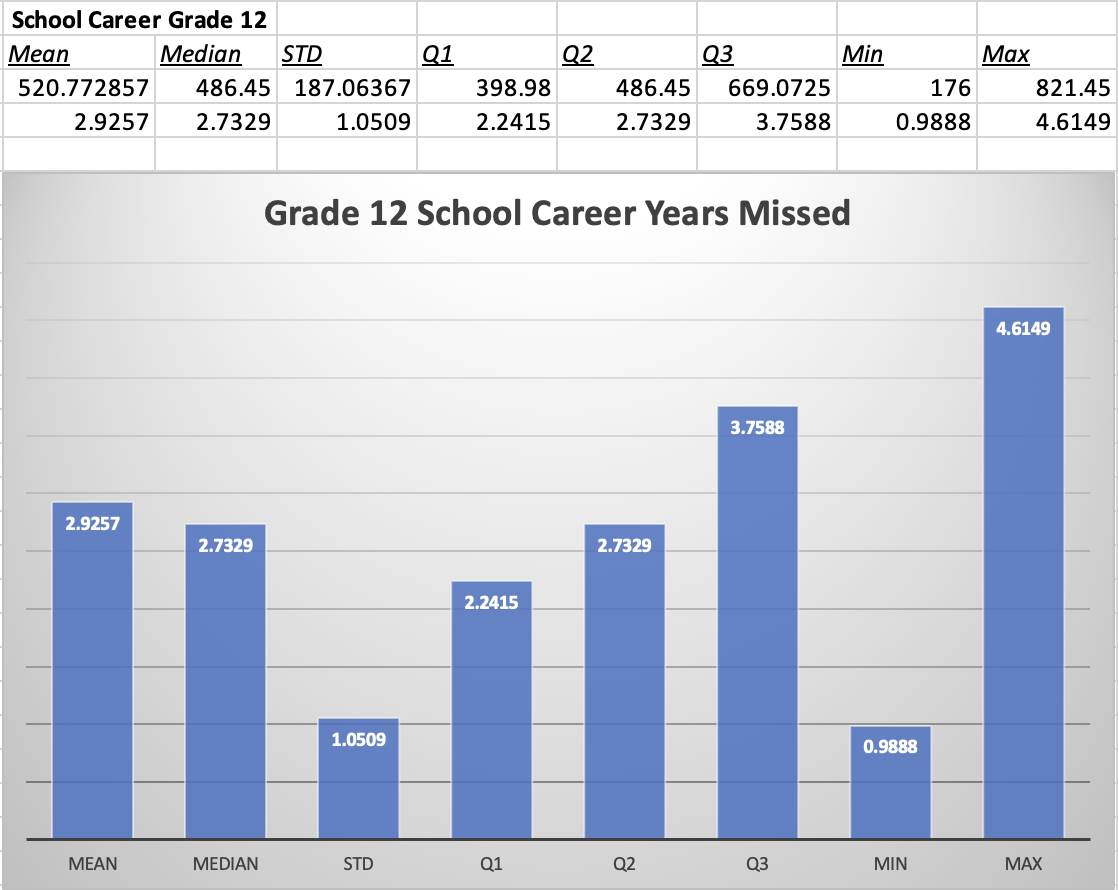
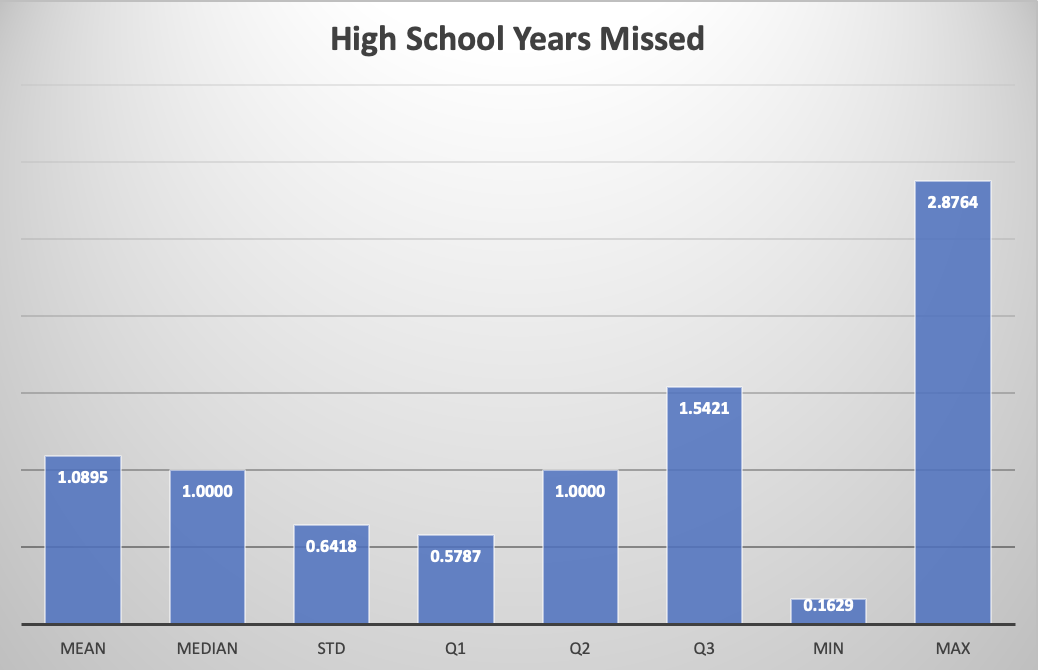
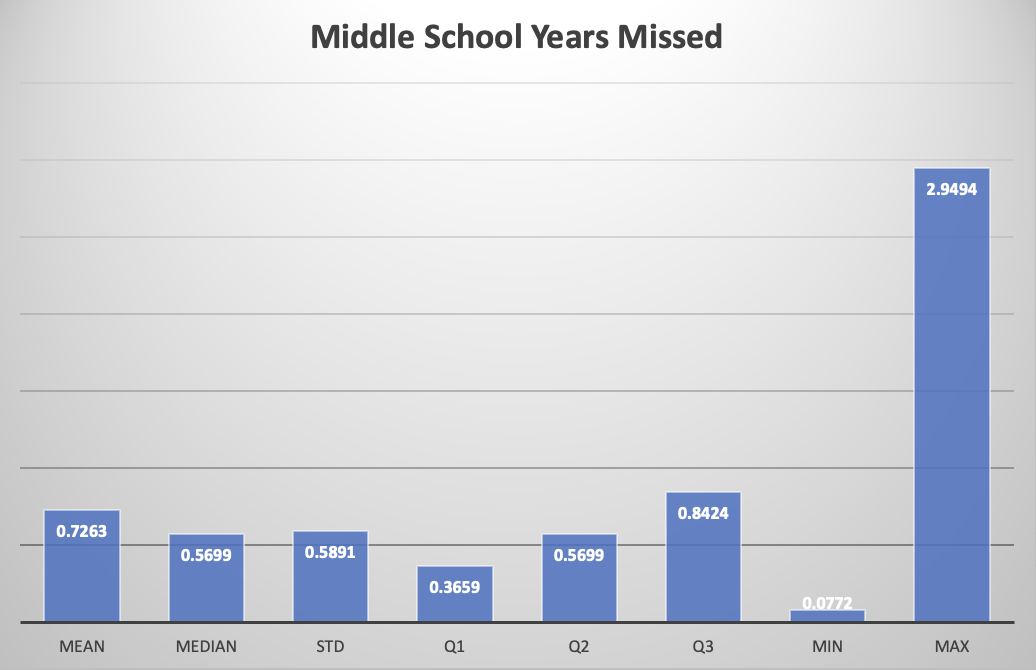
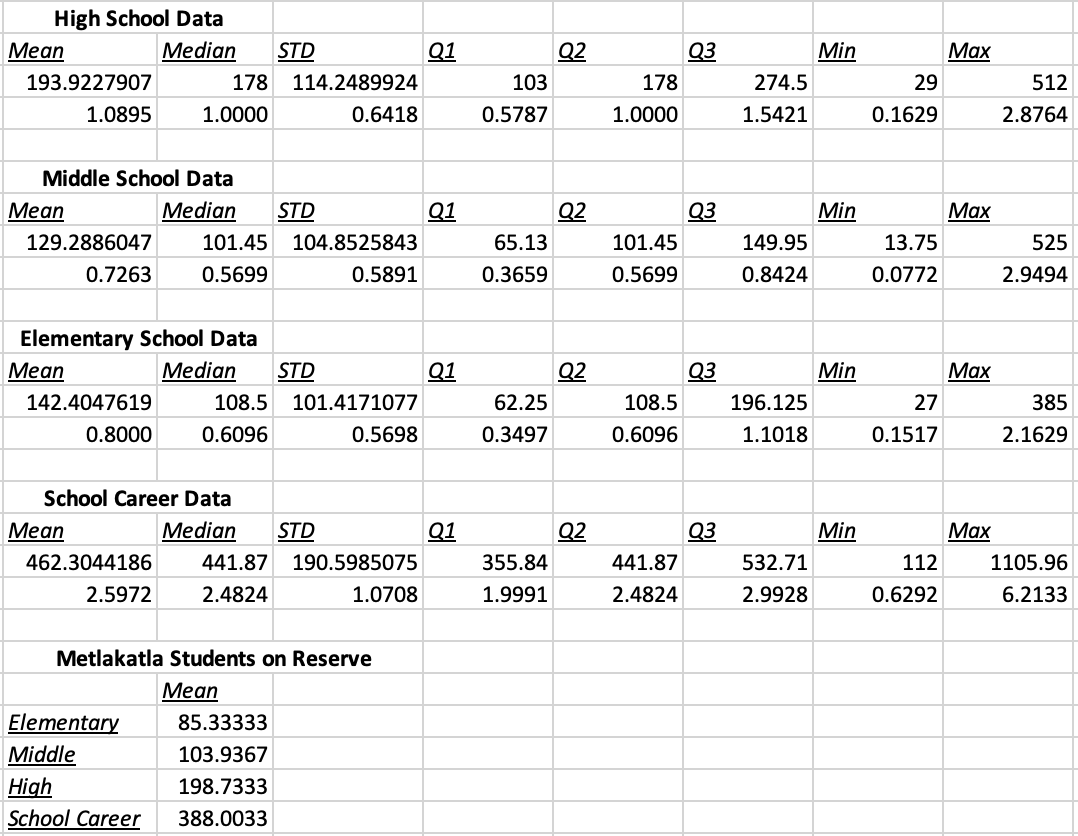
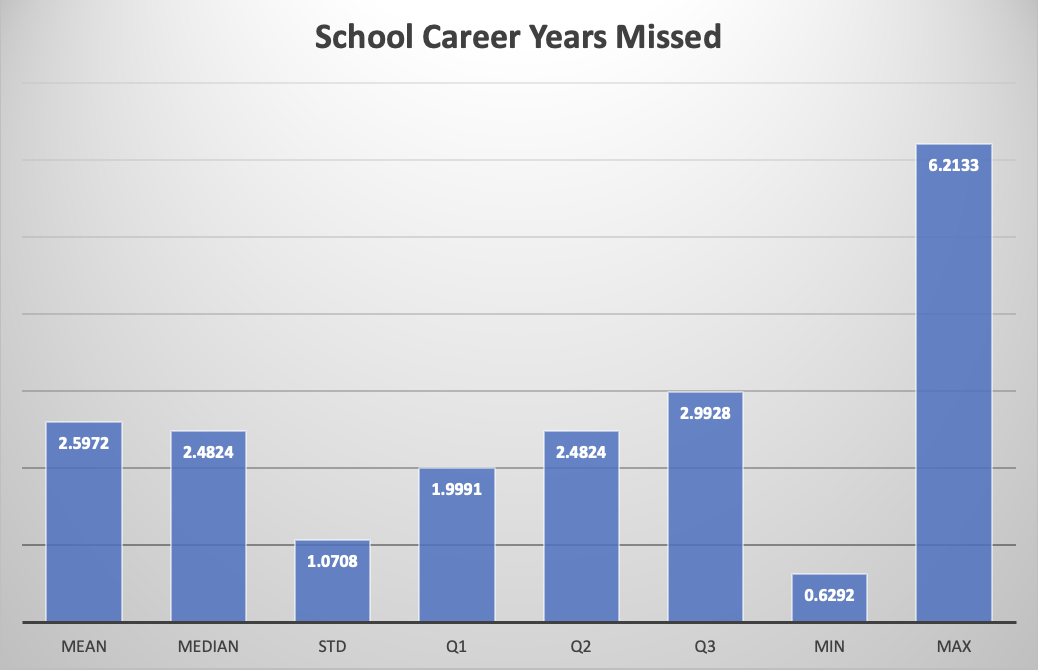
Stretches: Our students struggle with the academic parts of our school and need many access points to the curriculum. Most of our students have some level of gaps in their school career for a variety of reasons. Our data shows that by grade 12, on average, our students have missed ~ 3 years of schooling. Looking at all grade levels collectively our students have missed ~2.6 years of schooling. This number was come to by taking overall absences and diving by 178 which is the approximate days school is in session a year. Absenteeism is the core stretch for our students. This has been exacerbated by COVID, precarious housing, and challenging living situations.
Another stretch for many of our students is precarious housing and food security. These two elements are key elements of successful participation in schooling and education.
What evidence do we have of these strengths and stretches?
Strengths: This year we worked at finding quantitative ways to assess strengths of our students. We have the FESL, Demographics Survey, Attendance Data (yearly and historically), School Based analysis, and course completion.
FESL data showed a distinct increase in students attitude towards Reading. Attitudes towards school also showed some increase and remained very high. For example, when asked if there was someone at the school who cared about that student a positive response went from 90% to 97%. When asked if there is someone to help response went from 88% positive to 92% positive. This reveals that one of our best strengths is our staff's connection to students. Our goal is to convert this strength into higher academic success.
In conjunction with staff connection with students we have seen an increase in overall attendance. Our yearly average flow on a month to month basis through increased from 80% to 83%. We also had some success in moving students struggling with substance use and trauma into treatment centres. We had 3 students be successful in the ECE certification program. We had student success in food safe, infant first aid and WHMIS.
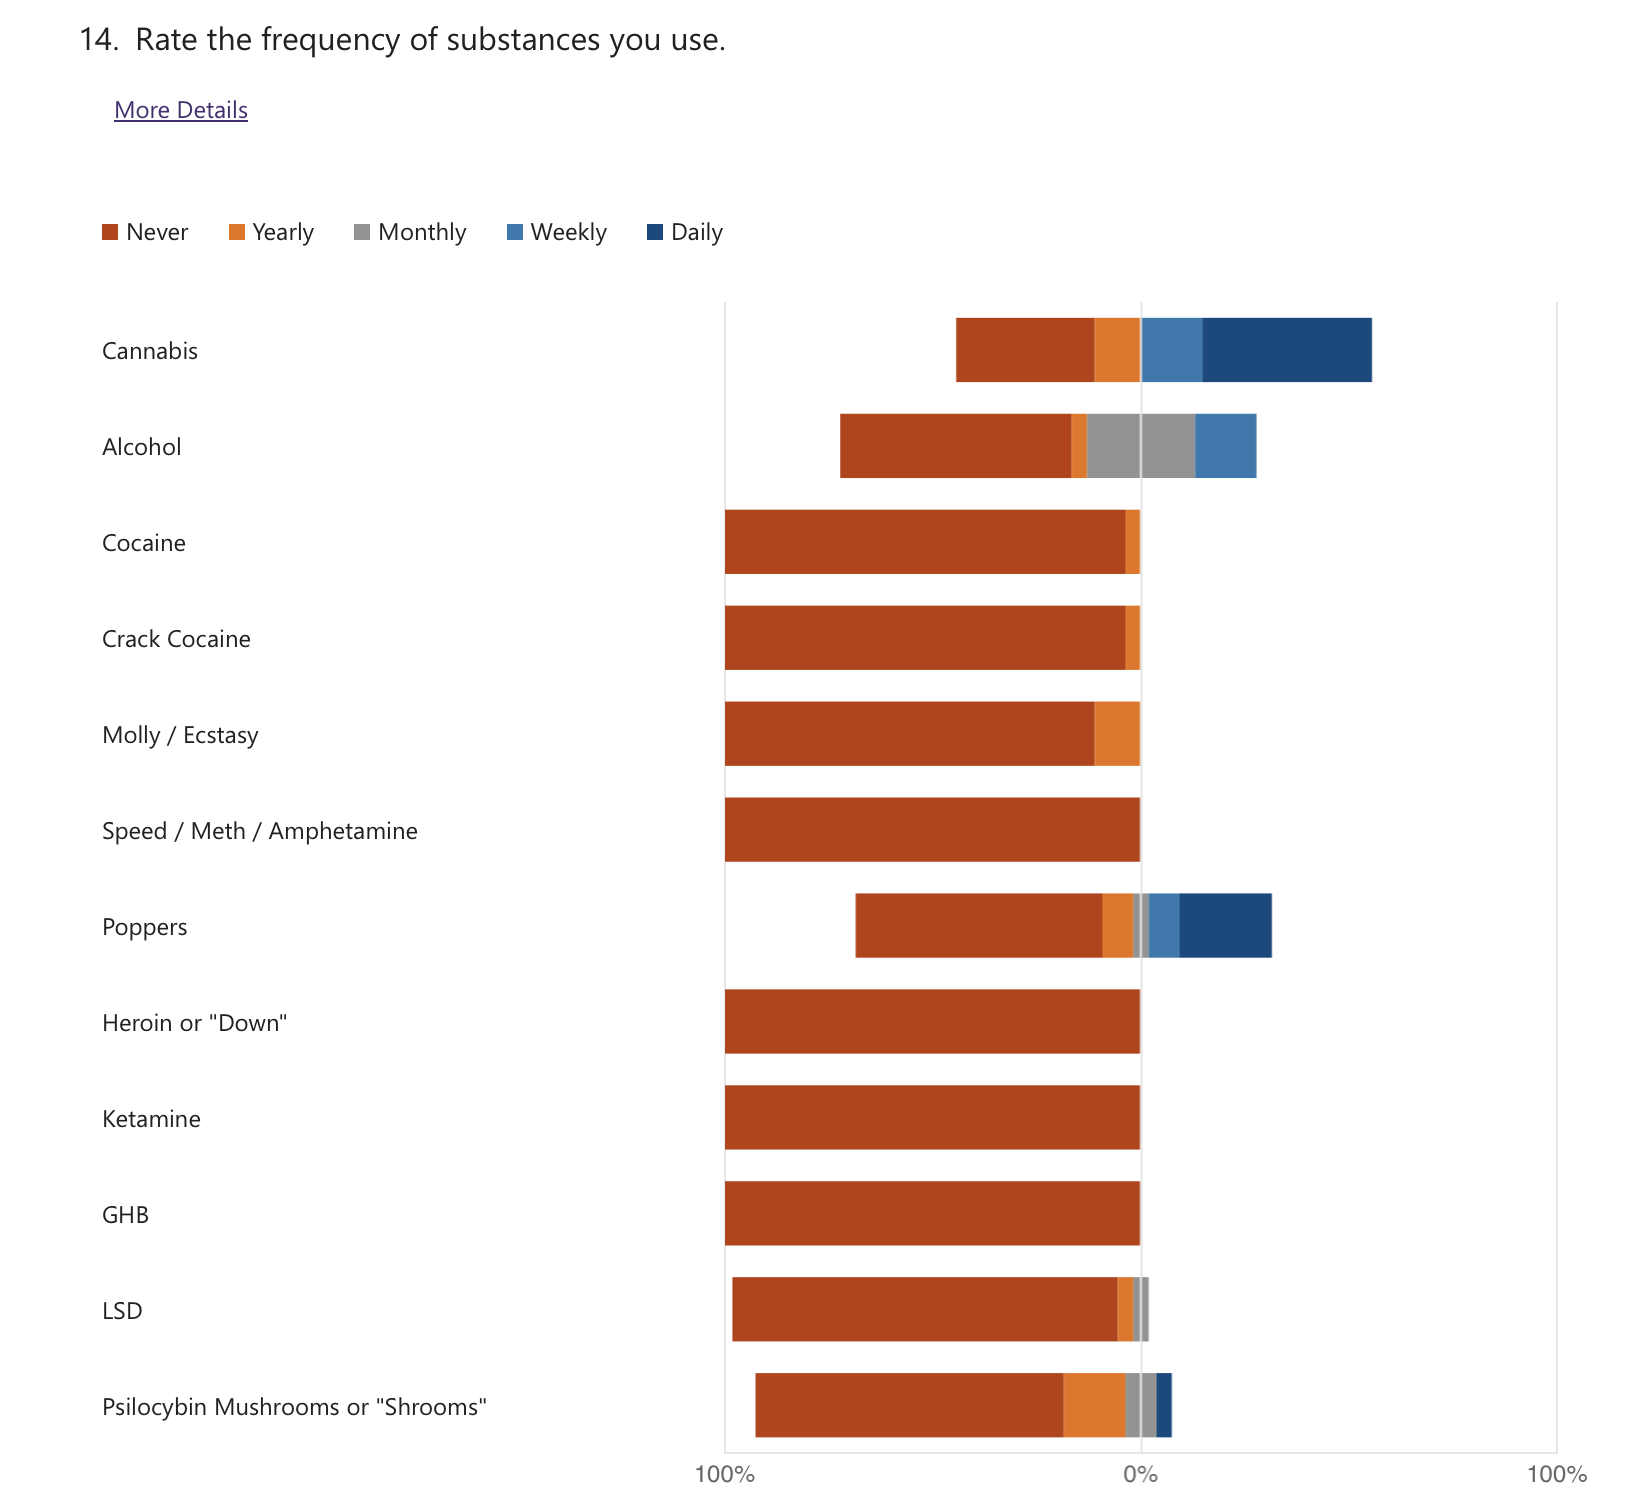
Stretches: Lifestyle and circumstances is a stretch for many of our learners. There are attached files which better define the data.
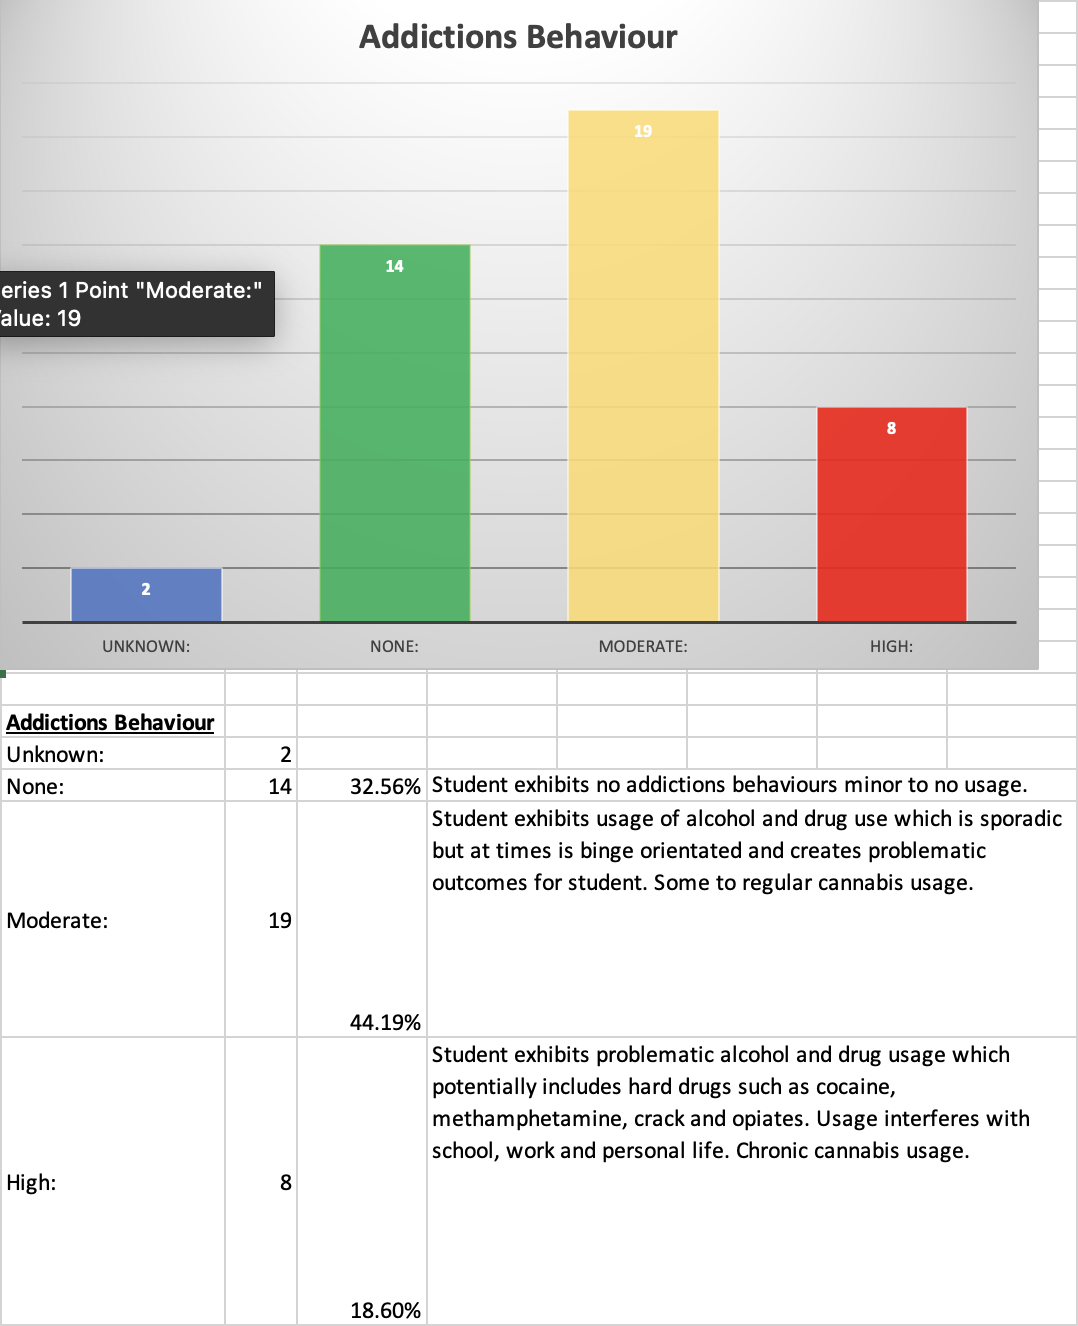
Addictions Behaviour
- None: 33%
- Moderate: 44%
- High: 19%
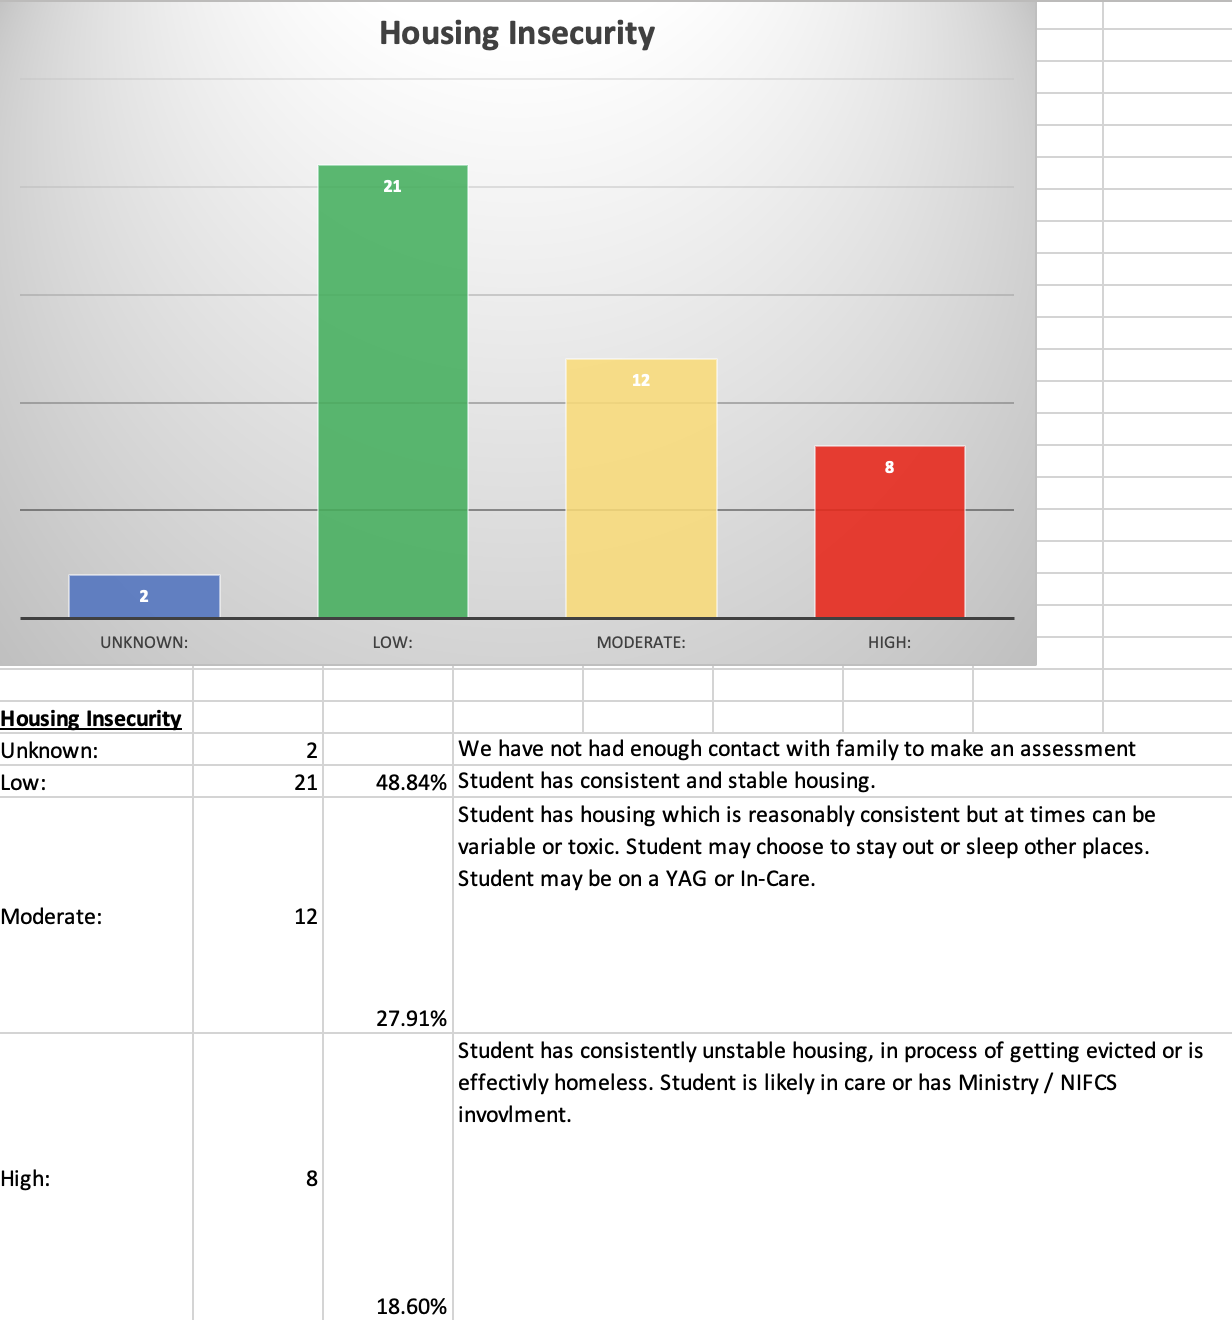
- Low: 19%
- Moderate: 28%
- High: 19%
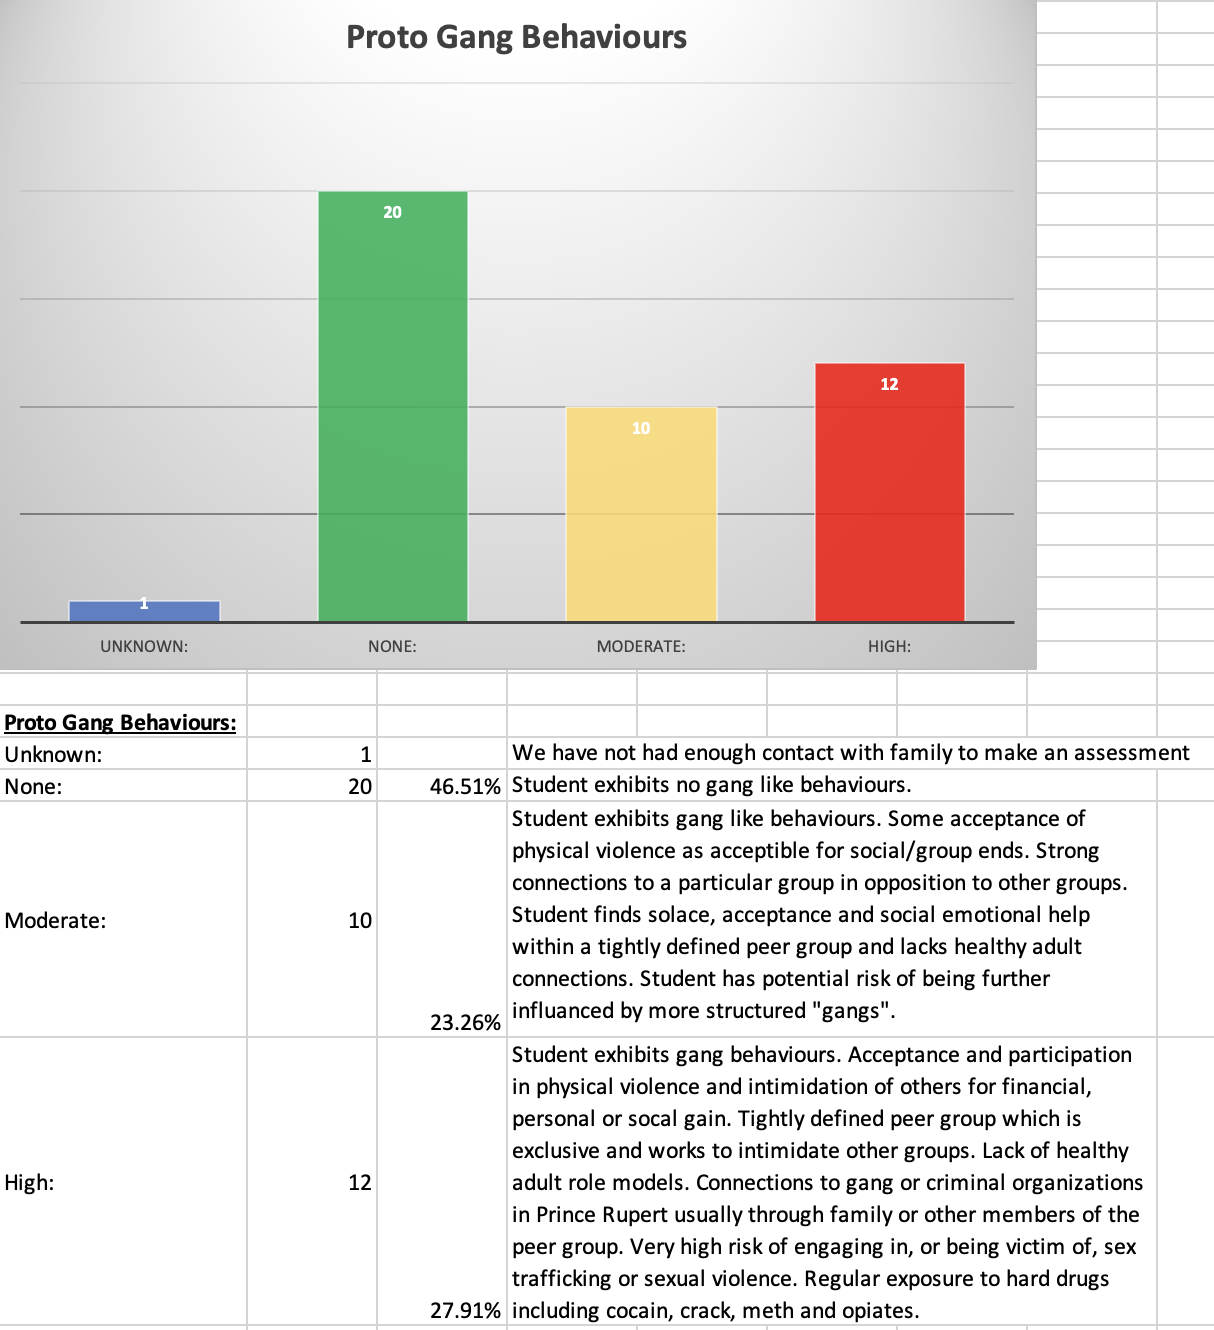
- None: 47%
- Moderate: 23%
- High: 28%
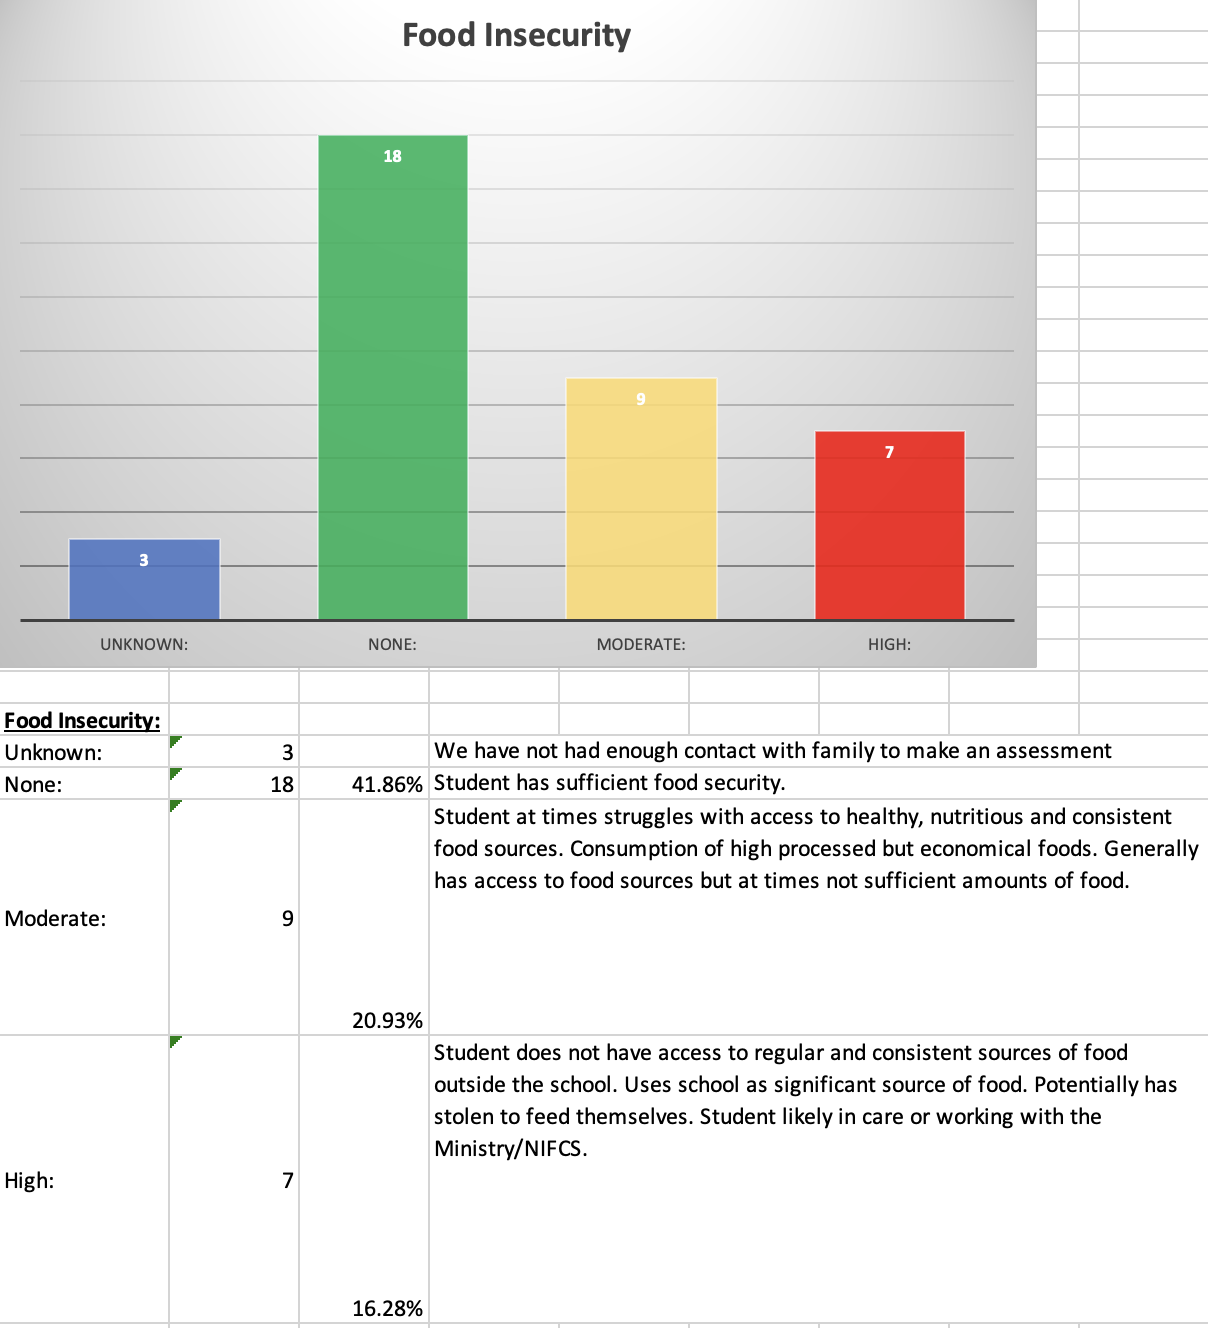
- None: 42%
- Moderate: 21%
- High: 16%
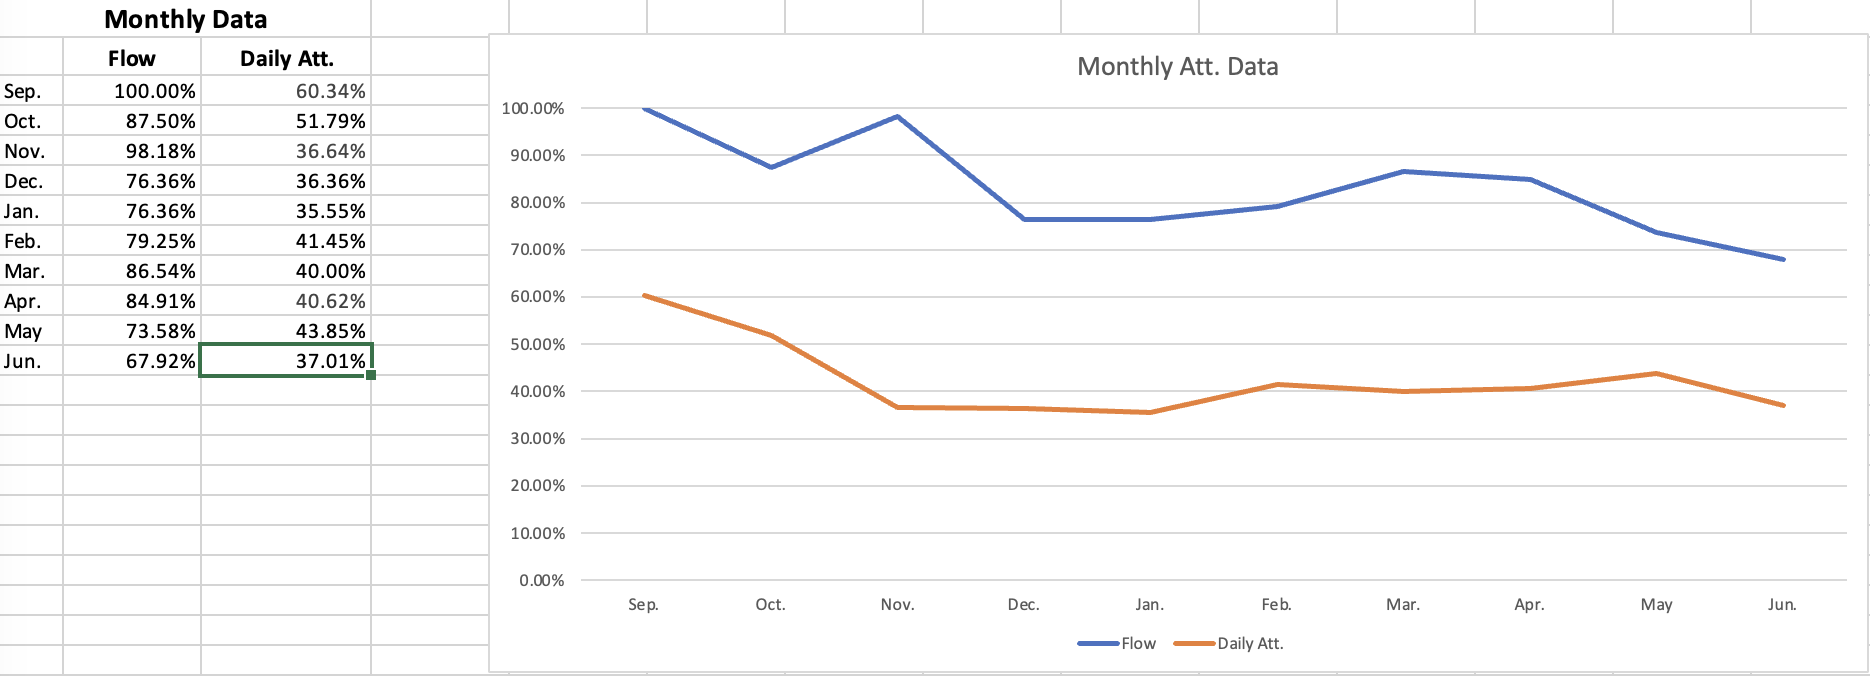
One of the biggest indicators of our students' struggles with academic parts are PCS's yearly course completion rates. This year our students completed 95 courses. This is only 1.26 courses per student. If we compensate for chronic non-attenders and look at those students who generally attended that number bumps up to 1.57 courses per student. Still too low. If we just consider students who had good average attendance on a monthly basis, course completion per student increases to 3.69 per student. We feel this shows that there is a causal relationship between attendance and completion. PCS has year to year enrolment and students generally take more than a year to complete a course. Teachers also have created an intake procedure for each student to gage their academic level and the appropriate place to start them. This is a good indicator that our students come to us generally a couple grade levels behind their age based grade level. Finally, we track our attendance data daily and have weekly reviews of our attendance. While our Weekly and Monthly Flow Through is strong our daily average attendance is weaker. This shows us that while students are connecting over the course of a month, their attendance lacks daily consistency. The most successful students are the most consistent with their attendance. This is an area our students, and our school, needs to work on improving.
Course Completion Data:
- Courses Completed: 95
- Courses Per Student: 1.26
- Flow Through Weighted Courses Per Student: 1.57*
- Daily Average Weighted Courses Per Student: 3.69**
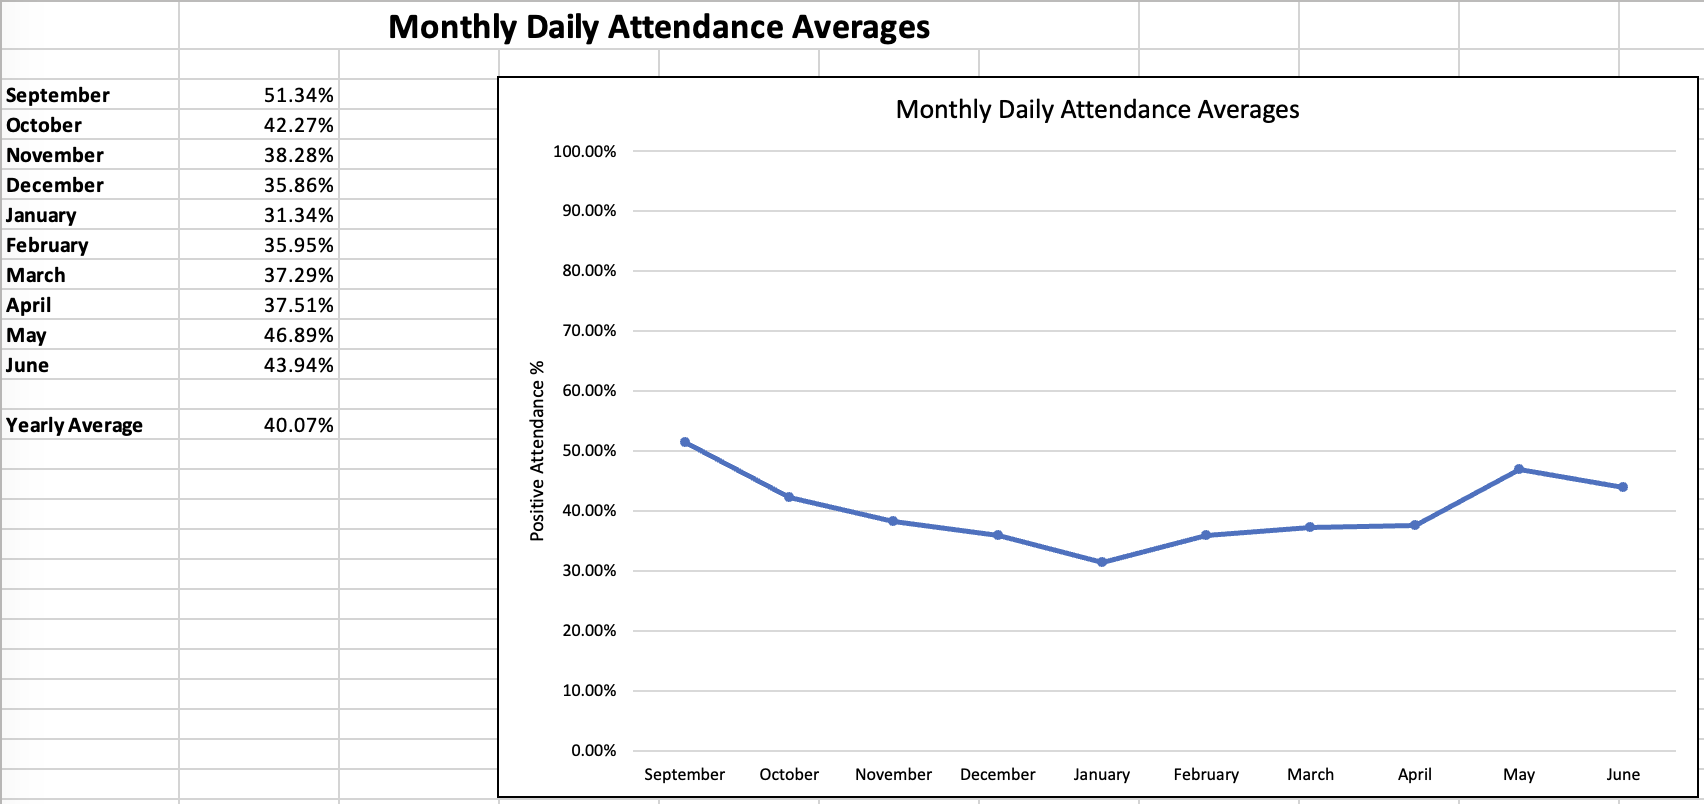
Monthly Daily Attendance Averages
- September: 47.47%
- October: 36.93%
- November: 39.18%
- December: 35.86%
- January: 31.34%
- February: 35.95%
- March: 37.29%
- April: 29.80%
- May: 24.17%
- June: 25.22%
* This is weighted by removing students who were severely chronically absent throughout the year and focusing on students whose attendance was within the "Flow Through" level.
** This is weighted by focusing on students who had good average attendance on a monthly basis.

What areas will we focus on to improve or enhance success for our learners based on what we know about them?
What are our specific goals?
- Implement 6 week block model.
- Continue engagement with outliers who are having trouble with the 6 week block model.
- Youth worker connecting with students and families with a particular focus on those not attending the 6 week block model sessions.
- Moving students to a Regular Grad model rather than Adult Grad
- While Grade 12s will most likely be graduating on an Adult Grad program for next year, having those students complete more courses than required for the Adult Grad.
- Promote a community space for our outliers who are having trouble participating in the new 6 week model.
- Creating an anytime counselling space for students.
What will teachers learn more about to support our goals?
What actions/strategies will we take/use (teachers, parents, students, and other stakeholders) to support our goals?
For the 2023/2024 school year we will be implementing a new program at PCS. This will be a 6 week block program with strict requirements around attendance. If students miss more than 3 days in a given 6 week period, they will no longer be allowed to attend regular days Monday to Thursdays; however, students can still connect and do some remedial work every Friday. Fridays will be self-paced and all enrolled students will be able to attend.
Teachers will deliver the course content within the context of Universal Design for Learning and a focus on the competencies. PCS will work with parents to engage their students in prompt attendance and classroom engagement. Students will be held to a high standard of attendance and behaviour. We will work with students to reduce the barriers we can while keeping high standards in place. Finally, we will work with outside agencies to help students with getting certifications, counselling and support.
What evidence of learning will we collect to check the progress on our goals?
The clear evidence of learning will be through course completions, student attendance and graduation. We will be collecting quantitative data on the following metrics:
- Course Completions
- Daily Attendance
- Flow Through Attendance
- Family Engagements
- Student Well Being
How will we share our plan with staff?
How will we share our goals with students?
How will we share our goals and progress with parents?